
Stress Indicator Used in the WSM Database
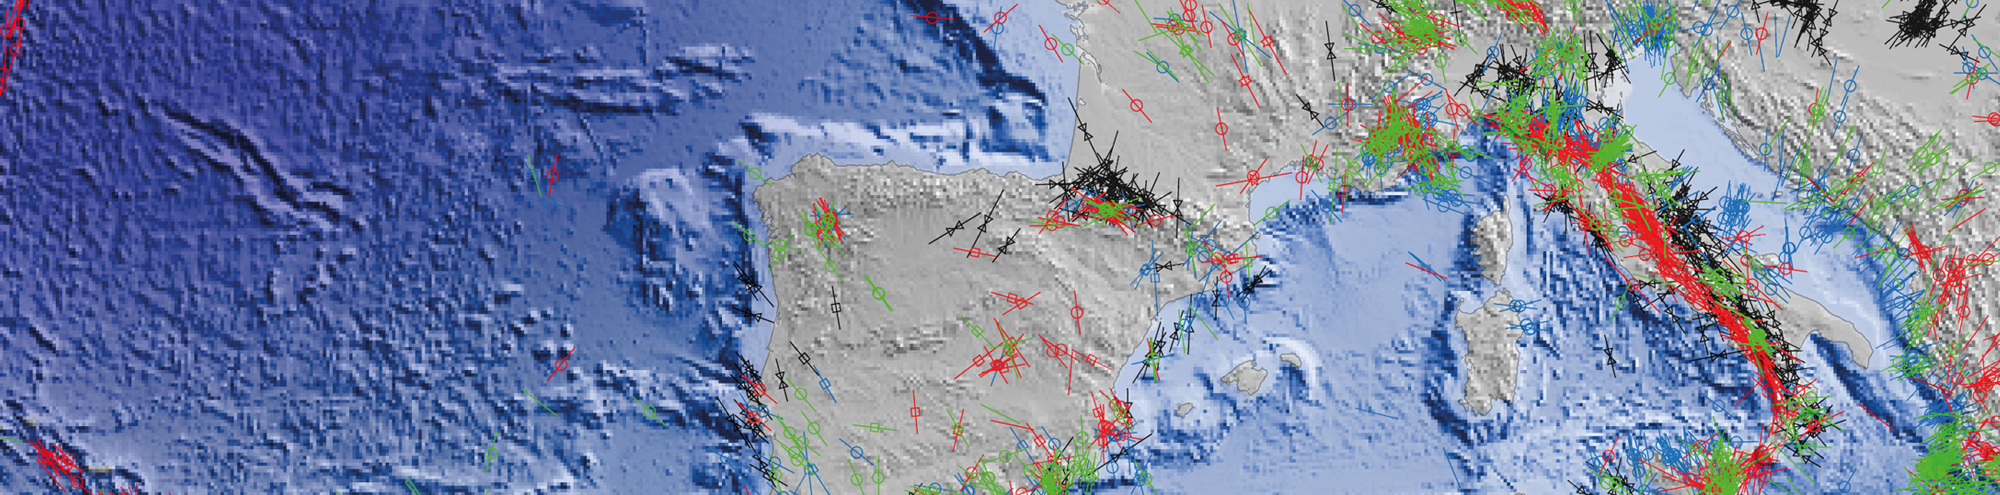
The WSM compiles information of the contemporary crustal stress from a wide range of stress indicators. Basis of the compilation is the WSM quality ranking scheme to guarantee comparability of the various stress indicators that reflect the stress state of very different rock volumes. The stress indicators are grouped into five categories:
- Earthquake focal mechanisms (single events and formal inversion)
- Borehole breakouts and drilling-induced tensile fractures
- In-situ stress measurements from overcoring and hydraulic fracturing
- Young geologic data from fault-slip analysis and volcanic vent alignments
- Shear wave splitting data from borehole sonic logs and crustal scale analysis
A detailed description of the different stress indicators in the context of the WSM project can be found e.g. in Zoback & Zoback (1991), Stephansson and Amadei (1997), Bell (1996), Ljundgren et al. (2003) and Sperner et al. (2003). The quality assignment of the individual stress data record is guaranteed through: (1) The WSM quality ranking scheme for each stress indicator according to international standards and (2) the WSM standardized regime assignment. For more technical details please read the WSM Technical Report 16-01. If you want to create your own stress map please use our online software tool CASMO.
WSM Quality Ranking Scheme
The success of the WSM is based on the WSM quality ranking scheme for each stress indicator. This quality scheme is mainly based on number, accuracy and depth of the observation. The WSM quality ranking scheme was introduced by Zoback & Zoback (1989; 1991) and then updated and extended by Sperner et al. (2003) and Heidbach et al. (2010). It is internationally accepted and guarantees reliability and global comparability of the stress data.
Each stress data record is assigned a quality between A and E, with A being the highest quality and E the lowest. A quality means that the orientation of the maximum horizontal compressional stress SHmax is accurate to within ±15°, B quality to within ±20°, C quality to within ±25°, and D quality to within ±40°. For most methods these quality classes are defined through the standard deviation of SHmax. E-quality data records do not provide sufficient information or have standard deviations greater than 40°. These data records are only kept for book keeping purposes that these data have been processed. In general, data records with A-, B- and C-quality are considered reliable for the interpretation of the crustal stress state. For more technical details we refer to the WSM Technical Report 16-01.