WSM Database Release 2025
The World Stress Map database release 2025 can be downloaded here as a file with comma separated fields and as an Excel spreadsheet. The database is public and thus the download and usage is free of charge. Details on the database structure and the individual fields are explained in the WSM Technical Report 25-01. When you use our data please cite the project and the WSM release 2025 as:
Heidbach, O., and M. Rajabi (2026), Patterns of contemporary horizontal stress orientation in the Earth's crust derived from the World Stress Map Database 2025, Solid Earth, 17(5), 735–745, https://doi.org/10.5194/se-17-735-2026 (download PDF)
Heidbach, O., Rajabi, M., Di Giacomo, D., Harris, J., Lammers, S., Morawietz, S., Pierdominici, S., Reiter, K., von Specht, S., Storchak, D., and Ziegler, M. O. (2025). World Stress Map Database Release 2025, GFZ Data Services, http://doi.org/10.5880/WSM.2025.00
Stress Maps Based on the WSM Databases
The World Stress Map 2025 can be downloaded here as a layered PDF-File where the user can turn on and off data records from different stress indicator, stress regime, and data qualities. Details on the data records displayed on the global stress map are explained in the WSM Technical Report 25-01. When you use the World Stress Map 2025 please cite it as:
- Heidbach, O., Rajabi, M., Di Giacomo, D., Harris, J., Lammers, S., Morawietz, S., Pierdominici, S., Reiter, K., von Specht, S., Storchak, D., and Ziegler, M. O. (2025). World Stress Map 2025, GFZ Data Services, doi.org/10.5880/WSM.2025.002
We also provide stress maps from individual countries or areas of key interest. These maps are edited with individual partners and institutions. The links will lead you to the landing page where you can download the map and receive further information. So far we have stress map for:
- Stress Map of India 2024
- Stress Map Taiwan 2022
- Stress Map Great Britain and Ireland 2022
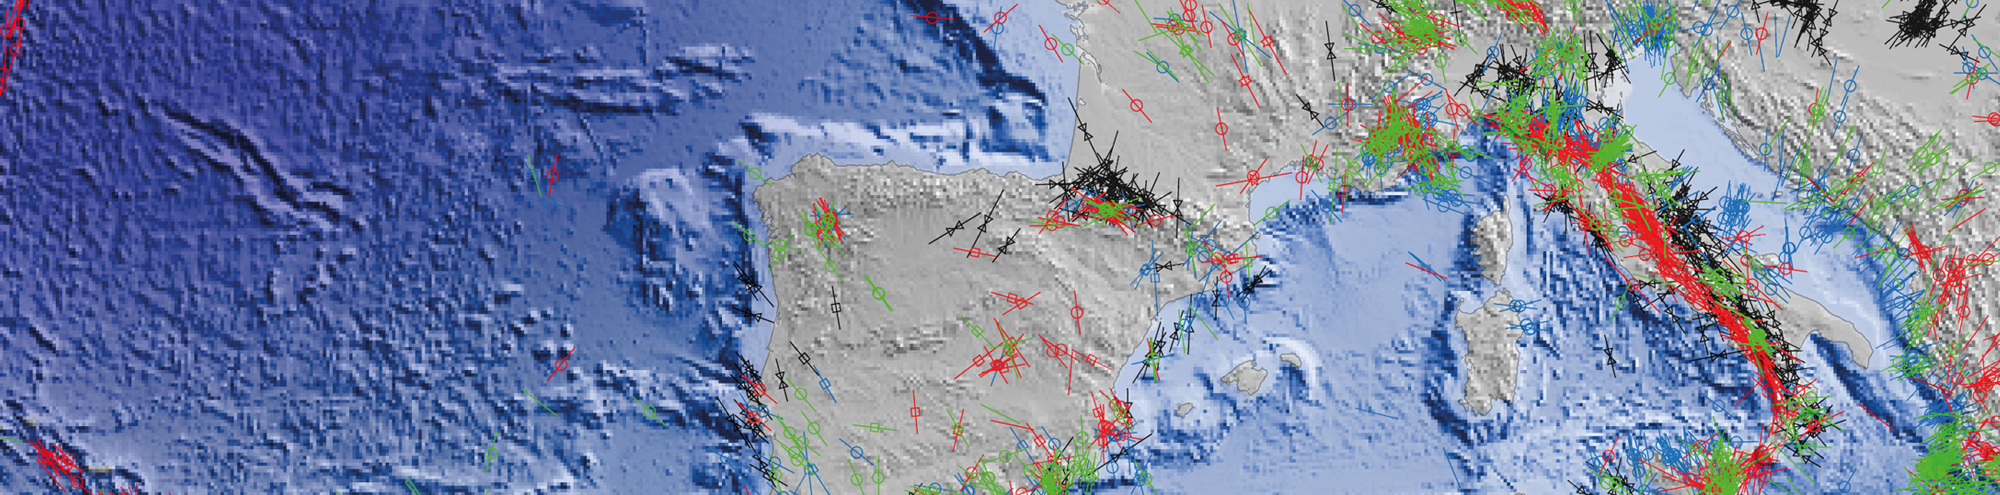
- Stress Map of the Mediterranean and Central Europe 2016
- Stress Map Germany 2016
- Stress Map Iceland 2016
Note that pdf-files have layers that can be turned off/on. E.g. you can display different data qualities or other features related to the display of the stress map. The stress maps are provided in printing quality for a format that is close to A0. If you need a stress map for your region of interest you can use our web-service CASMO - Create A Stress Map Online. Here you can select your area, data type and quality and add your own data and plot a high quality ready-to-print stress map.